I often hear people ask "How to calibrate between a subwoofer and a full-range speaker?". Take a closer look at this issue and see if you can get a satisfactory answer. Subwoofers are used to supplement the low-frequency lower limit of the full-frequency system. Specifically, there are three main factors. 
1. Bandwidth relationship between subwoofer and full frequency system (frequency division)
2. Output sound pressure level relationship (gain) for subwoofer and full frequency systems
3. Signal arrival time relationship (delay) for subwoofer and full frequency systems
The last item may be the most difficult, so let's study it first. At the same time, we should also briefly understand the problem of frequency division, solve these two problems, and the remaining gain problems are simple.
The speaker itself is a bandpass device. Therefore, in order to simplify the measurement and facilitate the observation of the image, the author will use high-pass and low-pass filters instead of the actual speakers. The results obtained in this way are basically in line with the actual situation, except that the actual measurement microphone cannot be added in such a simulation test, and thus the influence of the change of the microphone test position cannot be simulated. However, considering that the influence of the change of the position of the test microphone mainly affects the high-frequency part where the directivity of the speaker is relatively obvious, and the speaker exhibits a substantially omnidirectional characteristic in the low frequency band, and the influence of the position of the test microphone is small, So the problem of testing the position of the microphone is not enough.
Another factor that affects the position of the tested microphone is that different microphone positions cause the distance between the sound of the two speakers (bass and full range) to reach the test microphone to change. In this way, the results measured at some locations may be good, but if you change the measurement position, if the distance difference between the two speakers and the microphone is equivalent to 1.5 times the wavelength near the crossover point, then the overall response curve will be A valley appears (interference cancellation). Therefore, when performing on-site measurements, it is recommended that the test microphone be placed in a representative position of the amplitude and time difference in the audience area.
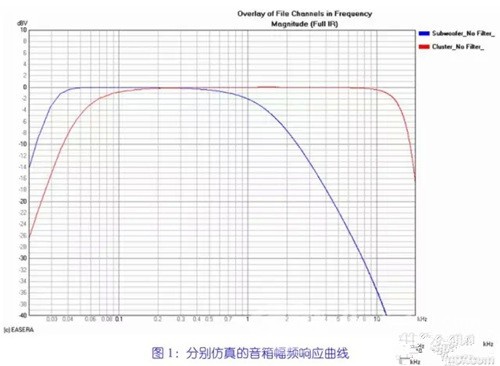 Let's assume that there is a full-range speaker system that can reproduce sounds from 60Hz to 14kHz. Then, add another subwoofer to another location in the venue. The lower limit frequency of the subwoofer can reach 30Hz. Their response curves are shown in Figure 1. Now we want to perform a 4th-order Linkwitz-Riley crossover correction with a frequency division of 100Hz.
 Since the response curve of the subwoofer near this crossover point is relatively straight, we can directly add a 100Hz 4th order LR low-pass filter to it. However, since the frequency response curve of the full-range speaker group has already appeared near the crossover point, we need to use an electronic filter lower than the 4th order, so that the sound output of the full-range speaker group and the 100Hz cutoff of the 4th-order LR filter The frequency fc matches. Figure 2 shows the output curve of the full-range speaker itself and the expected response curve of the 4th-order LR high-pass filter. In order to meet the requirements of the expected response curve, a 115Hz 3rd order Butterworth high-pass filter is added to the full-range speaker. If you need to match the expected response curve more accurately, you can reduce the cutoff frequency of the Butterworth filter appropriately, and then add a parametric equalizer for more precise edge adjustment. In short, let the response curve fit as much as possible into our desired curve.
 Figure 3 shows the response curve after combining the high and low subwoofer outputs. At this point, the overall amplitude-frequency response is completely out of compliance. It is obvious that there is offset. We know that the LR acoustic response of the two sets of speakers should be superimposed on the flat response curve. But there isn't it here, which means that there are problems with improper calibration of the two sets of speakers in the time domain. By observing the energy envelope curve (ETC) in the passband in Fig. 4, it can be confirmed that there is a problem of non-synchronization between the two. So we need to delay the full-range speaker group, but what is the appropriate amount of delay?
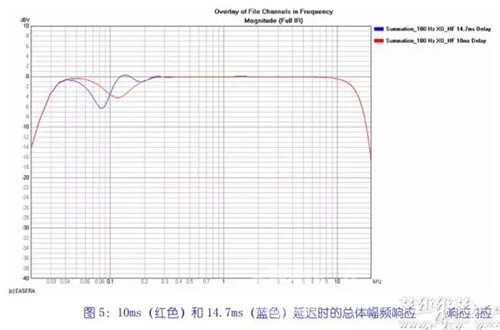
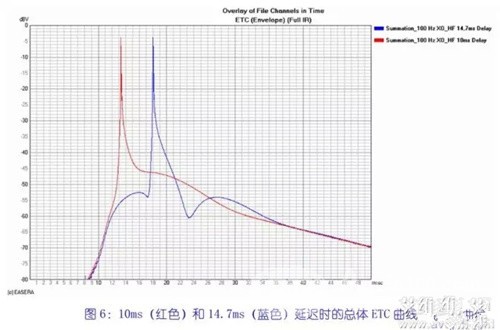
 If we choose to align the full-frequency peak arrival time with the ultra-low peak arrival time, we need to delay the full frequency by 14.7ms. Or we can make the full-frequency arrival time close to the leading edge of the ultra-low ETC curve. The delay time for this full frequency is about 10ms. Figure 5 and Figure 6 show the time-domain and frequency-domain images for the two cases, respectively, but the amplitude-frequency curves of the two do not seem to meet the (relatively straight) requirements and are seen from the time-domain image. Shorter results are more desirable than longer delays. If there is no other way, then we will continue to try to guess different delay times in order to find a result that will make both the time domain and the frequency domain characteristics ideal. Fortunately, however, we have a better way.
 The fundamental problem is that we currently only have low-frequency data for the subwoofer output. In the formula Δt=l/Δf, Δt is the time resolution, and Δf is the frequency resolution: from which we can see that higher frequency resolution (smaller Δf value) leads to lower time Resolution (larger Δt value). Therefore, we need to make the subwoofer output a higher frequency signal (equivalent to a higher Δf value, that is, lower frequency resolution) to improve the time resolution, so as to more accurately determine the delay time required for full frequency. . If possible, we can bypass the ultra-low low-pass filter to get more high-frequency output signals. This helps to more accurately determine the energy arrival time of the subwoofer. Suppose we can't bypass the filter now, or we can't get enough accurate time resolution even after bypassing.
At this point, we need to get accurate time information without the aid of high frequency signals. This seems like an impossible task. Indeed, it is impossible to do this simply in the time domain. But in the frequency domain, there is a way for us to get time information quite accurately, that is, group delay. The mathematical definition of group delay is the negative derivative of the phase with respect to frequency.
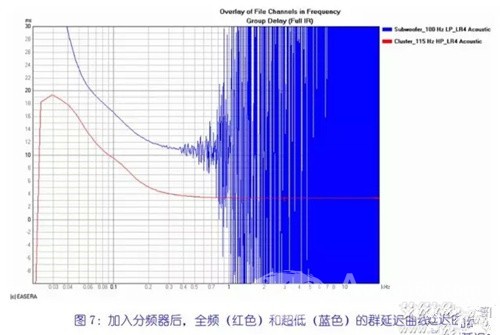 Figures 3 and 4 show different (domain) views of the individual passbands of the speakers during the same measurement. If we look at the group delay image of the same data, we can get some valuable information. The flat area of ​​the high frequency portion of the curve in the figure represents the signal arrival time of the speaker group. As can be seen from the figure, the arrival time of the full frequency portion is approximately 3.3 ms, which is in good agreement with the ETC curve in FIG.
 Don't be bothered by the high frequency part of the subwoofer curve. Those fluctuations are caused by the measured signal to noise ratio of 400 Hz or higher. Referring to Figure 3, the output of the subwoofer drops 24dB at 200Hz, and we use a 4th-order filter, so the speaker output will be below -48dB and rapidly slamming at 400Hz. It is no wonder that the high-frequency part of the signal-to-noise ratio is so bad.
 We can look at the position of about 300 Hz on the ultra-low group delay curve to get the high frequency time limit of the group delay. The corresponding figure in the figure is about 11.0 ms. The group delay of the full-range speaker at this frequency is about 3.9ms. This is slightly different from the 3.3ms of the full-range speaker at high frequencies. This difference is due to the phase shift caused by the high-pass filter and the high-pass characteristics of the speaker itself. Ultra-low filters also bring similar phase shifts, which can be measured if we have enough measurement signal-to-noise ratio.
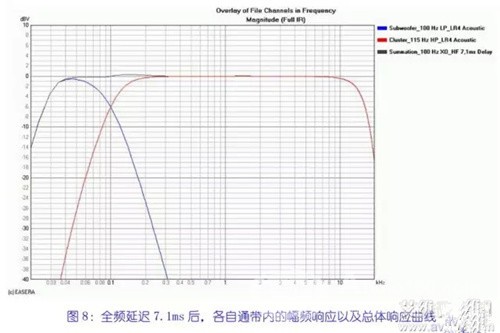
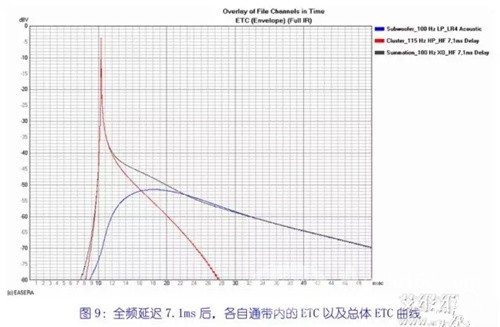
 Subtracting 3.9ms from 11.0ms gives a delay of 7.1ms. According to this value, the delay is set to the full frequency, and the results are shown in Fig. 8 and Fig. 9. This is basically what we want. There is a deviation of less than 0.5 dB around 150 Hz in the figure. This is because the output of the HF speaker group does not closely match the LR response curve (see Figure 2).
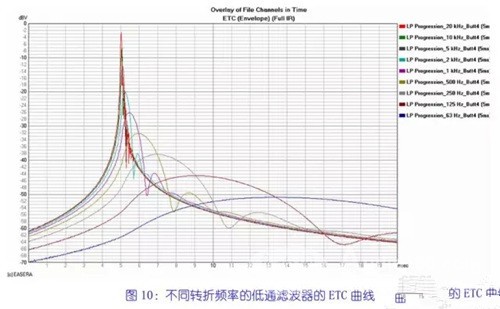
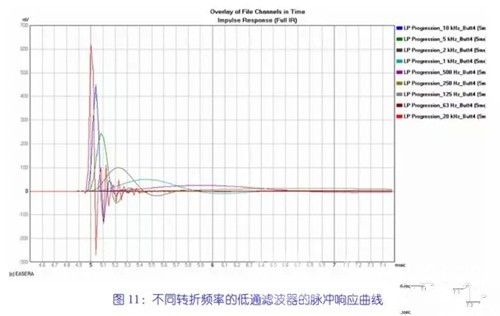 Another point I think will help to understand the factors that seem to affect the arrival time of the low-pass filter. The reason why it is "looking like" is because this situation only occurs when the arrival time changes. The ETC and impulse response images of a 4th order Butterworth low pass filter are shown in Figures 10 and 11, respectively. The only difference between these curves is at the corner frequency (-3dB) of the filter.
The true arrival time of these filter curves is 5ms. A complementary high-pass filter with a 5ms arrival time is superimposed on the complementary low-pass filter. If the high-pass filter is set to have a delay of more than 5 ms, then the superimposed curve of the filter will produce the same problems as in Figures 5 and 6.
In summary, we have seen that the response of an electronic filter is superimposed on the response of the loudspeaker to achieve the desired output response (calibration). We also learned why low-pass devices can make the arrival time behave later than the actual value. We also demonstrated how to use group delay to accurately calibrate the delay time of devices with limited output frequency limits. I hope the above can help everyone.
For the 22kV Oil Immersed Power Transformer, we can produce capacity upto 420MVA. We use the best quality of raw material and advance design software to provide low noise, low losses, low partial discharge and high short-circuit impedance for power transformer.
Our power transformer are widely used in national grid, city grid, rural grid, power plant, industrial and mining enterprise, and petrochemical industry.
220Kv Transformer,220Kv Power Transformer,High Quality Power Transformer,Oil Immersed Transformer
Hangzhou Qiantang River Electric Group Co., Ltd.(QRE) , https://www.qretransformer.com