TDR (Time Domain Reflectometry) measurements provide a direct description of the signal integrity of a cable or PCB (printed circuit board) trace, as well as analysis of IC performance and faults. The TDR measurement sends a fast pulse along the cable or PCB trace and displays the returned reflection to indicate the change in impedance. Impedance changes can be very strong, such as open or shorted, or as small as fF, such as a PCB via. This technology takes the form of OTDR (optical TDR) and utilizes the equivalence between the dielectric constant of the electronic system and the refractive index of the optical system.
The history of TDR
Engineers in the late 1930s began using TDR to measure the dielectric constant and moisture content of soil. Today, many engineers still use this technology for a variety of geographic measurements, such as earthquake breaks.
Layers and bridges are “scouredâ€, which is a dangerous situation that occurs under fast rivers, especially under freezing conditions. This is the case with running water carrying debris from piers, burial equipment and similar structures (Reference 1, Reference 2 and Reference 3). After World War II, engineers completed TDR testing with independent pulse generators and oscilloscopes. The digital logic chip generates a 5V swing pulse that produces enough reflection to be detected. An important advance in the late 1960s was when HP (now Agilent) introduced the 1415A plug-in instrument for its 140 main oscilloscope. For the first time, this high-performance instrument integrates a pulse generator and a sampling head in one unit. In the 1970s, Tektronix introduced the 1502 and 1503 TDR test suites for a wide range of applications in cable integrity testing. The military has always been an enthusiastic user of TDR equipment, and Tek offers a military version of these products. Nuclear bomb testing requires TDR to measure miles of cable and geophysical phenomena in the blast zone.
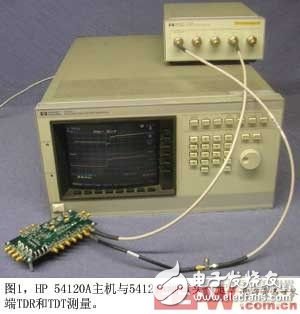
The technology implementation of Tektronix and HP will continue in the next few decades. HP developed the 20 GHz 54120A mainframe and the 54121A test head (Figure 1). These products include a computerized TDR test suite and can be used for TDT (Time Domain Transmission), which requires additional inputs for monitoring circuit transmission in addition to pulse input and digital reflection. This method can determine the loss characteristics of the circuit; it is impossible to measure these losses with a purely reflective instrument. The oscilloscope uses detectors from the HP Network Analyzer in the sampling head.
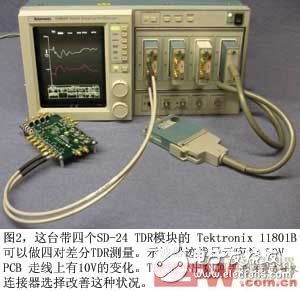
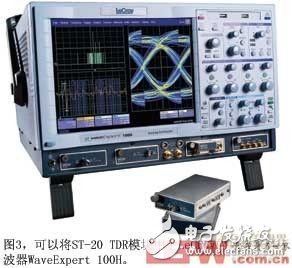
In the 1980s, Tektronix introduced the 50 GHz 11801 oscilloscope mainframe and the 20 GHz SD-24 differential TDR module (Figure 2). To enable other modules to monitor transmissions, the 11801 can perform TDR and TDT and can evaluate differential signals such as those in LVDS (Low Voltage Differential Signaling) and SCSI (Small Computer System Interface) circuits. The oscilloscope later evolved into the 11801C, while the module with a 35 ps rise time pulse generator remained unchanged. The oscilloscope has been widely used in the industry for many years, although its user interface is a bit elusive and may be more suitable for control via GPIB (Universal Interface Bus) rather than an engineer operating on the front panel. HP is not satisfied with the vested glory, and soon introduced the 18GHz 54754A module for the 86100A mainframe. Tektronix also followed the introduction of the 17 ps 80E04 module for the CSA803 (derived from the 11801C). Tektronix's modules now include the 70GHz DSA8200 mainframe and the 50GHz 80E10 module. At the same time, competitor LeCroy offers the 100GHz WaveExpert 100H and a 20GHz ST-20 TDR module (Figure 3).
The TDR manufactured by Picosecond Pulse Labs is the ultimate device: the 4022 add-on module accepts Tektronix, Agilent or other TDR pulses at an amazing 9 ps rise time. Picosecond also manufactures pulse generators, but using the 4022 to speed up an oscilloscope's pulse rate has its own advantages. Picosecond CTO Clayton Smith said: "We made it work with existing software in the oscilloscope." Picosecond also manufactures TDR modules for various oscilloscope OEMs.
In addition to the development of high-end TDR, there are also instruments that can do what TDR did in the 1950s: checking for long cables, short circuits, and broken wires. This feature is very important to the US Navy because modern ships have miles of cable. Broadcasters and TV operators also use TDR to find cracks in coaxial cables on antenna towers. Tektronix's TS90 TelScout TS90 100 is one such machine; there is also a Spirent E2520 tester that can evaluate up to 9,800 feet of twisted pair cable.
Technical premise
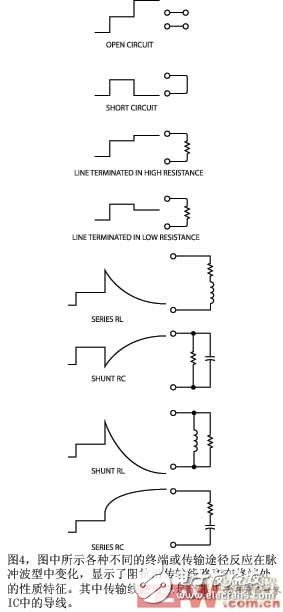
The theory of TDR involves some mathematics about waveform propagation and transmission line impedance (Reference 4 and Reference 5). The physical phenomena of TDR are neither easy to understand nor intuitive. A short-circuit or open-circuit portion of a wave to test the cable seems normal. Most people can directly observe this phenomenon. The more challenging is the concept that a wave propagating to an open circuit is added to the input wave to double it, and a wave entering a fully shorted circuit is reflected back to a negative potential, causing the associated waveform to be 0V. As you might expect, if the transmission line uses its characteristic impedance termination, such as 50Ω for a 50Ω cable, no reflection will occur and the pulse will not be damaged. The only logical thing is that when the terminal resistance value is slightly higher than the matching impedance, a small bump is generated in the pulse reflection, and the lower resistance resistor causes a drop in the pulse. The reflection of the terminal in an inductive or capacitive situation is also straightforward because the capacitor is a high frequency short circuit and the inductor is a high frequency open circuit (Figure 4).
The traditional transmission line lumped component model leads to another thing: the model is a string of inductors that are grounded in parallel with capacitors. The ratio of capacitance to inductance determines the exact value of the characteristic impedance, for example, 50Ω, 75Ω or 300Ω. Physics has shown that a line in the air has an inductance, so as long as a current flows through the line, a magnetic field that satisfies Gauss's law is produced: if there is a net charge Q in the space within an arbitrarily closed mathematical surface, then Through it
The electric flux Φ of the surface is Q/eo.
Imagine a line in space that provides the distributed inductance seen in the lumped component model of the transmission line. Now, suppose that this line is in space close to the ground plane or the reference plane. This proximity causes the model to produce a lumped capacitance. It seems that placing the line close to the plane should reduce the impedance because the capacitance is increased. Similarly, if a PCB trace has a thick dot above the ground plane, it will also increase the capacitance and reduce the impedance along that point. A via appears as a small capacitor that couples to the ground plane to reduce impedance. Conversely, a small jumper (such as a connector gold finger) will leave the board surface and ground plane, thus reducing the distributed capacitance and increasing the impedance along this line. When using TDR measurements, you can place your own finger or a metal tool on the PCB trace and look at the impedance change directly on the oscilloscope screen (like adding a capacitor).
The TDR theory shows that the faster the pulse rise time, the smaller the characteristics that the instrument can resolve. In the past, simple cable testers had nanosecond rise times. Today's TDR instruments can check short-circuit cables and PCB traces, connector impedance, and IC package impedance. Therefore, they require a rise time of the order of 10 ps to 30 ps. These fast pulses require a high speed oscilloscope to record reflections and transmissions. The extreme speed requirements of high-resolution TDR measurements make the TDR module almost always part of a relatively low sample rate sampling (or equivalent time) oscilloscope. The high-speed analog amplifiers in the front end of these devices support far more bandwidth than the best real-time oscilloscopes.
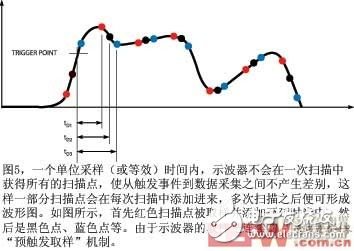
The trigger circuit in the oscilloscope slightly moves the device's acquisition point after each trigger event (Figure 5). This technique "draws" a fast waveform when displaying a set of wobble samples for each trigger event on the screen. However, the sampling oscilloscope can only be used for repeated waveforms. Video, radar, or cell phone signals that are different for each scan will only appear as a blur. This limitation is not a problem in TDR testing because the pulses are repetitive waveforms that can be continuously fed into the test circuit, giving the sampling oscilloscope time to build the waveform.
Dima Smolyansky, Tektronix Product Marketing Manager and a contributing contributor to EDN, said: “Sampling oscilloscopes were originally developed to address the bandwidth requirements that real-time oscilloscopes cannot meet.†More insights can be found in his article “TDR and S-parameter measurements. "How high performance do you need?" He said: "The real-time oscilloscope is in the 10GHz to 20GHz range, and the sampling oscilloscope can give you a wider bandwidth, up to 70GHz. The sampling oscilloscope is more accurate in the time domain, and the real-time oscilloscope Compared to the same bandwidth it is a low-cost solution."
Design considerations
System-level engineers prefer to stay in the time domain rather than the frequency domain that RF and analog IC designers like. System-level engineers see TDR as a more natural and intuitive way to explore the performance of high-speed circuits. Conversely, the frequency domain equivalent parameter of TDR is the scattering parameter, or the S parameter. An excellent theoretical group describes the information equivalence of two measurement techniques (Reference 6). You can directly measure the S-parameter in the frequency domain using a VNA (Vector Network Analyzer), which sweeps a circuit with a fixed-amplitude sine wave while recording the amplitude and phase of the reflected and transmitted signals. Knowing the phase and amplitude of these S-parameters, the characteristics of the circuit can be determined, and the bandwidth is comparable to that of an oscilloscope that the VNA can scan. VNAs have a wide dynamic range (or signal-to-noise ratio SNR) and narrow-band filters that are scanned with an oscilloscope; therefore, they can reject most out-of-band noise. In contrast, a wideband oscilloscope must be used to complete the TDR measurement, so it also has the characteristic that all wideband circuits exhibit a higher effective noise floor.
RF and microwave engineers like the S-parameters on the VNA for several reasons: one is their dynamic range, which can reach 130 dB. In addition, RF engineers often need to understand the steady-state performance of the circuit. They assume that the oscillator in the circuit is running and that a relatively narrow band (such as a 1900 MHz cell phone frequency) is passing through the system. On the other hand, engineers concerned with signal integrity must pay attention to the entire spectrum. They need to know how their system reacts to a series of pulses after a DC voltage appears on the cable or trace. This situation makes people more inclined to use TDR measurements. Engineers designing PLLs (phase-locked loops) have two problems: they must determine their operating characteristics while the loop is running, and they also have time domain problems, that is, the loop lock must be observed after a few milliseconds. This problem may represent the main operating frequency of millions or hundreds of millions of cycles and poses special challenges for the development of PLLs. These problems make PLL design, simulation and testing a daunting task
Engineers should be aware of some caveats, although the S-parameters have mathematical equivalence in the frequency domain and TDR in the time domain. There are important calculations between FFT (Fast Fourier Transform) and inverse FFT between the time domain and the frequency domain, often involving causality and passivity (Reference 8). A causal problem occurs when the calculation does not take into account the transition time and other delays that cause time domain problems. A similar problem also arises in passivity: the inverse transformation into the time domain can be distributed to passive circuit component energy, producing erroneous results. Entering the frequency domain from the time domain also imposes an SNR limit. Since time domain measurements are subject to wideband noise, even the best TDR settings produce only 50 dB of SNR at high frequencies. This number may be enough. In addition, you may need to use a VNA to get S-parameter data directly in the frequency domain. Remember to weigh the convenience of obtaining S-parameters and TDR measurements on one machine and verifying at least one measurement in both domains. However, some TDRs can be compared to a 9ps rise time TDR and a 50GHz VNA.
Therefore, if the appropriate equipment is used correctly, it can be converted between the two domains (Reference 9). TDR's reliable S-parameter data requires a pulse generator with a short rise time and a wide bandwidth oscilloscope. Similarly, when performing inverse FFT on S-parameter data to generate TDR data, you need enough bandwidth on the VNA to give the details you want to see in the time domain.
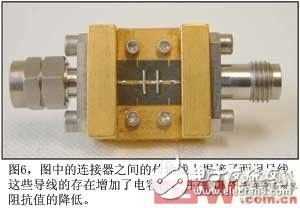
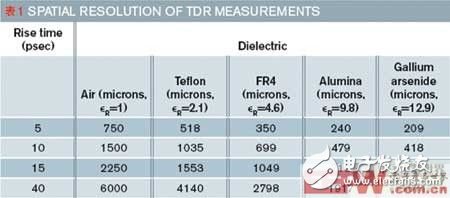
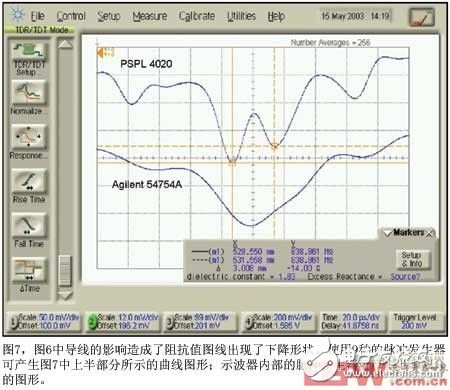
A good spatial resolution can be obtained with a good TDR (Figures 6 and 7). The emergence of faster than 10 ps pulse generators and 50 GHz or 100 GHz bandwidth oscilloscopes can be used for IC package development and fault analysis. If the TDR can resolve the impedance on the millimeter segment, you can see the effect of the wiring and whether the metallization damage will cause an IC to malfunction. With a high-speed pulse generator and oscilloscope, tiny spatial resolutions can be achieved (Table 1). In addition, some high-performance oscilloscopes have software technology that further improves the effective resolution for calibrating the reflections from the device and connecting the device under test to the circuit cable.
Eliminating the role of test fixtures is just one of the advantages of modern TDR oscilloscope software. The software of the Agilent 86100A main unit can be used to obtain differential TDR measurements with two positive pulses. Using pulses of the same polarity simultaneously on both channels ensures that both channels are excited with the same waveform. The difficulty is to accurately match the rise and fall times of a pulse, so differential pulse generation leads to a common mode error. The Agilent oscilloscope emits two pulses of the same polarity; then its software is inverted and overlaid on the response, so that the resulting waveform is exactly the same as a differential TDR, but with less error. Joachim Vobis, a product manager at Agilent, said: "Because the electronic circuits are much better matched, the accuracy is improved."
LeCroy also has similar powerful software in its WaveExpert 100H oscilloscope. A standard TDR analysis package can be used to calibrate test fixtures to generate differential S-parameters for two ports from TDR data. The oscilloscope comes with a wizard that guides the user through the design and calibration process. You can also set the rise time of the internal pulse generator from 20 ps to a smaller value, such as the value specified by the Serial Interface Standards Group.
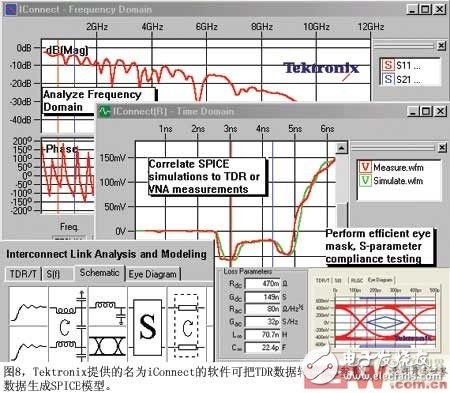
In Tektronix's DSA8200 sampling oscilloscope, the software TDR and TDT are only part of the overall package, and the software package is used to analyze communication parameters. Tektronix also offers iConnect software that runs on the DSA8200 mainframe or runs standalone on a PC (Figure 8). It converts TDR data into S-parameters, analyzes jitter, and improves the native TDR resolution of the DSA8200. The software also uses TDR data to derive the SPICE model of the circuit being analyzed. For example, you can build a SPICE model for a ribbon cable that carries high-speed LVDS serial data. This SPICE model is then handed over to the IC designer to show the complex impedance of the load or to evaluate the transmission medium during system level simulation.
TDR has evolved from a simple technique for inspecting cables to a sophisticated method of determining the complete time domain characteristics of fast digital signals. TDT is also evolving, and the current resolution can be used to check and determine the characteristics of the IC's internal structure and circuitry. In addition, powerful software advances the use of TDR, from viewing bumps on oscilloscope waveforms to calibrating ohms and inches. Software can make TDR data produce S-parameter frequency domain characteristics and even infer an equivalent SPICE model. The oscilloscope graph that generates the model can also be used to validate the simulation of the model and produce valid results.
TDR results have an important advantage over frequency domain analysis: TDR plots show impedance problems in a circuit. Picosecond Pulse Labs' Smith said: "It helps you isolate problems that may be displayed in the frequency domain with VNAs, but you don't know where the problem is in the circuit. TDR can determine the exact point of the signal path problem." Smith continues to point out some real-world problems with high-speed connectors. “We purchased a full-turn edge-inserted SMA connector to evaluate our test setup. We saw great differences in signal integrity through these connectors. Simply put, engineers used VNA and frequency domain analysis, But the TDR response is terrible.†With TDR, you get instant, intuitive results that tell you where to start improving your circuit. Be sure to include this valuable measurement technique in your own treasure trove of debugging techniques.
VAPEAK VISION Vape is so convenient, portable, and small volume, you just need to take them
out of your pocket and take a puff, feel the cloud of smoke, and the fragrance of fruit surrounding you. It's so great.
We are the distributor of the ovns & vapeak vape brand, we sell ovns disposable vape,ovns vape kit, ovns juul compatible refillable pod, and so on.
We are also China's leading manufacturer and supplier of Disposable Vapes puff bars, disposable vape kit, e-cigarette
vape pens, and e-cigarette kit, and we specialize in disposable vapes, e-cigarette vape pens, e-cigarette kits, etc.
vapeak vision vape bar,vapeak vision vape pen,vapeak vision vape device,vapeak vision vape disposable,vapeak vision vape box
Ningbo Autrends International Trade Co.,Ltd. , https://www.mosvape.com