MEMS inertial sensors play an important role in many of today's personal electronic devices. Small size, low power consumption, ease of integration, powerful functionality and superior performance have driven innovation in devices such as smartphones, game controllers, activity trackers, and digital photo frames. In addition, MEMS inertial sensors for automotive safety systems can significantly increase system reliability and reduce system cost, enabling automotive safety systems to be used in most automobiles.
The continuous development of functional integration and performance also helps to apply MEMS accelerometers and gyroscopes to many different industrial systems. Some of these applications are low-cost alternatives to existing products and services, while others are beginning to integrate inertial sensing. As an application with two types of users, vibration monitoring is also in the ascendant. Traditional instrumentation for monitoring mechanical health for maintenance and safety needs typically uses piezoelectric technology. High-speed automation equipment monitors vibration to trigger feedback control of lubrication, speed or belt tension, or shuts down the equipment for quick inspection by service personnel.
Despite the mature user base of piezoelectric devices, MEMS accelerometers offer the advantages of easy integration and reduced cost for emerging user groups. In addition, the advanced functional integration of MEMS accelerometers allows the integration of embedded RF transceivers in devices such as the ADIS16229 digital MEMS vibration sensor, enabling a complete solution that combines signal processing and communication functions. Such programmable devices can automatically wake up periodically, capture time domain vibration data, perform fast Fourier transform (FFT) on data records, perform user configurable spectrum analysis of FFT results, and provide simple pass through efficient wireless transmission lines. /Failed result, accessing data and results, then returning to sleep. New users of vibration detection believe that rapid deployment and reasonable cost of ownership are important reasons for choosing fully integrated MEMS devices.
Vibration monitoring application
Using vibration to observe machine health is designed to correlate observable vibrations with typical wear mechanisms such as bearings, gears, chains, belts, brushes, shafts, coils, and valves. In a typical machine, at least one wear mechanism requires regular maintenance. Figure 1 shows three examples of the relationship between normal wear mechanism vibration and time. While determining this relationship requires time and experience, the well-associated vibration signature is a low-cost alternative to short-cycle periodic maintenance. Using actual observations, such as vibration, can quickly take action when an alarm condition (red curve) is detected, while avoiding premature maintenance of the machine that has not expired (blue and green curves).
Figure 1 also shows two alarm settings (alarms, critical) and three phases (early, medium, and final) for the machine maintenance cycle. The alarm level specifies the maximum vibration frequency during normal operation, where the observed vibrations do not present a potential hazard to the machine or technical support personnel. In the normal range, some instruments can be used to measure occasional vibrations. The critical level indicates that there is a risk of serious damage to the asset, which can cause insecurity to the support staff or the environment. Obviously, the machine operator wants to avoid operating the machine at this level and usually stops using the machine. When the vibration exceeds the alarm level but is below the critical level, the machine can continue to work, but the observation frequency should be increased and additional maintenance may be required.
Sometimes, these three operating areas (normal, alarm, critical) can correspond to three phases of the machine maintenance cycle: Early, mid-term, and final, the vibration monitoring strategy for each phase may vary. For example, in the early days, it may only be necessary to observe the main vibration properties of the instrument on a daily, weekly or monthly basis. In the medium term, it may be necessary to observe it once an hour, and at the end of the period, the frequency of vibration monitoring may be even higher, especially when personnel or assets are at risk. At this stage, the cost of repeating the machine using the portable device for vibration monitoring will gradually increase, which may be prohibitively high compared with the maintenance cost. While it is necessary to take special care of important assets, many other instruments cannot afford this duplication. Complementing manual measurements, embedded MEMS sensors provide a more cost-effective method for devices that require real-time vibration data.
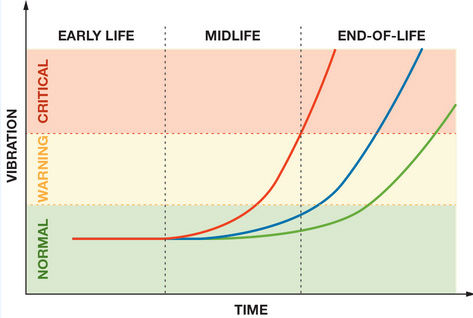
Figure 1. Example of vibration versus time
The nature of vibration
Vibration is a repetitive mechanical movement. There are several important attributes to consider when developing a vibration testing instrument. First, the oscillatory motion tends to have both linear and rotating elements. Most vibration detection relationships tend to focus on amplitude of oscillation rather than absolute position tracking, so linear sensors such as MEMS accelerometers are sufficient for capturing motion information. When it comes to linear motion, it's important to understand the direction of motion, especially when using a single-axis sensor. In contrast, 3-axis sensors have greater mounting flexibility because the orthogonal directions can be picked up on one or more axes without being affected by the direction of vibration.
Since vibration is periodic, spectral analysis is a convenient way to determine the characteristics of the vibration curve (the relationship between vibration amplitude and frequency). The curve shown in Figure 2 has both broadband and narrow-band components. The main body vibration frequency is about 1350 Hz, and there are 4 harmonics and some low-level broadband components. Each active device has its own vibration profile, while the narrowband response generally represents the natural frequency of the device.

Figure 2. Example of a vibration curve (natural frequency: approx. 1350 Hz)
Signal processing
The sensor selection and signal processing architecture depends on the application target. For example, the signal chain shown in Figure 3 continuously monitors a particular frequency band, providing warning lights and key light signals through nearby control panels. Manufacturers' knowledge of mechanical design contributes to the design of bandpass filters, especially in terms of start frequency, shutdown frequency, and bandpass roll-off rate. Rotational speed, the natural frequency of the mechanical structure, and vibrations that vary from fault to failure can affect the bandpass filter. Although this method is very simple, vibration monitoring requirements may change when there is historical data for a particular machine. Changes in monitoring requirements can result in changes in the filter structure, which can result in repetitive engineering costs. Developers can digitally respond to key signal processing functions (such as filtering, rms calculations, and level detectors), use auxiliary I/O outputs to control indicator lights, gain flexibility for flexibility, or provide digital output .

Figure 3. Example of a time domain vibration signal chain
Figure 4 shows the ADIS16228 signal chain ADIS16228 using a digital triaxial vibration sensor with FFT analysis and storage to monitor the spectral content of the vibration of the device.
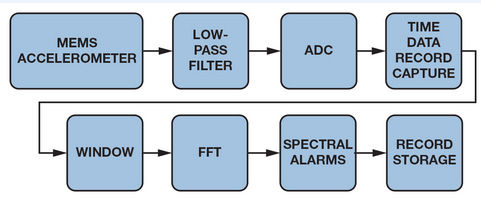
Figure 4. ADIS16228 signal chain for spectral vibration analysis
Kernel sensor
Both types of core sensors can be MEMS accelerometers. When selecting a core sensor, the most important attributes are number of axes, package/assembly requirements, electrical interface (analog/digital), frequency response (bandwidth), measurement range, noise, and linearity. While many three-axis MEMS accelerometers support direct connection to most embedded processors, achieving maximum performance may require a single or dual axis solution with analog outputs. For example, the ADXL001 high-performance broadband iMEMS accelerometer uses 22-kHz resonance to provide the widest bandwidth, but it is just a single-axis analog output device. In systems with analog-to-digital conversion channels, analog outputs enable fast interfaces, but current development trends seem to favor those with digital interfaces.
The frequency response and measurement range of the core sensor determine the maximum vibration frequency and amplitude that can be supported before the output is saturated. Saturation reduces the spectral response, producing spurious components that can cause fault alarms, even when the saturation frequency does not affect the target frequency. The relationship between the measurement range and the frequency response is as follows:

Where D is the physical displacement, ω is the vibration frequency, and A is the acceleration.
The frequency response and measurement range limit the response of the sensor, and its noise and linearity limit the resolution. The noise determines the lower vibration limit that will be reflected in the output, while the linearity determines the amount of fault harmonics produced by the vibration signal.
Analog filter
The analog filter limits the signal components to a Nyquist zone, which is half the sampling rate of the example system. Even if the filter cutoff frequency is within the Nyquist zone, it is impossible to resist high frequency components without restriction, and these high frequency components may still be folded back into the passband. For systems that only monitor the first Nyquist zone, this wrap-around behavior can produce false faults and distort the vibration components at a particular frequency.
window
In vibration detection applications, temporal coherent sampling is often impractical because non-zero sample values ​​at the beginning and end of the time record can cause large spectral leakage, potentially reducing FFT resolution. Applying a window function before calculating the FFT helps control spectral leakage. The optimal window function depends on the actual signal, but the factors that typically need to be measured include process loss, spectral leakage, sidelobe position, and sidelobe levels.
Fast Fourier Transform (FFT)
FFT is an efficient algorithm for analyzing discrete time data. The process converts the time record into a discrete spectrum record, where each sample represents a discrete frequency band of the Nyquist zone. The total number of output samples is equal to the number of samples in the original time record, which in most cases is one of the two-order series (1, 2, 4, 8...). The spectral data includes both amplitude and phase information and can be represented in a rectangular or polar format. When represented by a rectangle, half of the FFT bin contains modulus information and the other half contains phase information. When expressed in terms of polarity, half of the FFT bin contains real results and the other half contains imaginary results.
In some cases, both amplitude and phase information are useful, but the amplitude/frequency relationship contains information that is often sufficient to detect critical changes. For devices that only provide amplitude results, the number of FFT lines is equal to half the number of samples in the original time domain record. The FFT spectrum width is equal to the sample rate divided by the total number of records. To some extent, each FFT spectrum is like a separate bandpass filter in the time domain. Figure 5 is a practical example of a MEMS vibration sensor with a sampling rate of 20480 SPS starting at 512 points of recording. In this case, the sensor only provides amplitude information, so the total is 256 and the spectral width is equal to 40 Hz (20480/512).
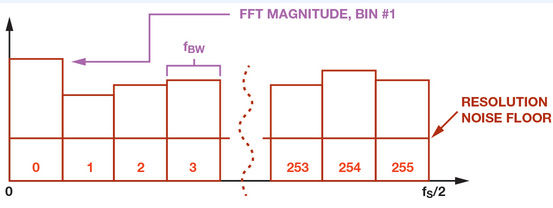
Figure 5. ADIS16228 FFT output
The spectral width is very important because when the frequency is converted from one spectral line to one adjacent spectral line, the spectral width determines the frequency resolution and also determines the total noise involved. The total noise (rms) is equal to the product of the noise density (~240 μg/√Hz) and the square root of the spectral width (√40 Hz), which is approximately 1.5 mg rms. For low frequency applications where noise has the greatest impact on vibration resolution, before the FFT process A decimation filter is used to increase the frequency and amplitude resolution without changing the sampling frequency of the ADC. The decimation calculation is performed at a sampling rate of 256 pairs of 20480 SPS, which can increase the frequency resolution by 256 times and reduce the noise by 16 times.
Spectrum alarm
A key advantage of using FFT is the ability to simplify the application of spectrum alarms. The example in Figure 6 includes five independent spectrum alarms that monitor the machine's natural frequency (#1), harmonics (#2, #3, and #4), and the broadband component (#5). The alarm and critical levels correspond to levels in the machine health vibration versus time curve. The start and stop frequencies complete the process variable definition represented by this relationship. When using an embedded processor, the spectrum alarm definition variables (start/stop frequency, alarm/critical alarm level) may be in configurable registers configured with digital code. This process can be greatly simplified by using the same scale factor and line numbering scheme.
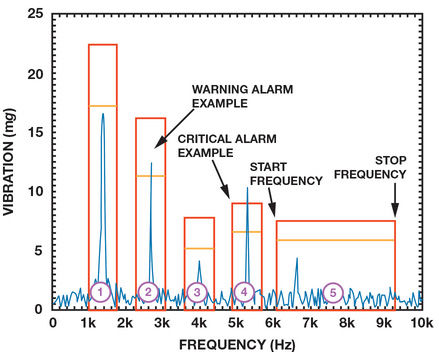
Figure 6. FFT example (with spectrum alarm)
Record management
Record management is a key function associated with process variable relationships. Storing FFT records at different stages of the life of each machine analyzes multiple behaviors and then plots a wear curve to aid maintenance and safety planning. In addition to collecting historical vibration data, capturing conditional data related to power, temperature, date, time, sampling rate, alarm settings, and filtering is also of great value.
interface
The interface depends on the existing infrastructure in a particular plant. In some cases, there are a variety of industrial cable communication standards (such as Ethernet, RS-485) to choose from, so the interface between the smart sensor and the communication system may be an embedded processor. In other cases, the same embedded processor can be used to connect smart sensors to existing wireless protocols such as Wi-Fi, ZigBee, or specific system standards. Some smart sensors (such as the ADIS16000 wireless gateway for remote sensors and the ADIS16229) come with an out-of-the-box wireless interface that can be used via common embedded interfaces such as SPI or I2C.
in conclusion
MEMS inertial technology has ushered in a new era of vibration monitoring and has won a wider user base for such instruments. Performance, packaging, and familiarity may help piezoelectric technology continue to work, but it is clear that vibration monitoring is evolving and progressing. With advanced functional integration and excellent adaptability, MEMS devices are gaining more and more attention in new vibration monitoring applications. The advanced signal processing technology of the detection point brings great convenience, simplifying the monitoring burden in most cases into a simple state (normal, alarm, critical). In addition, remote data access via a convenient communication channel creates new application opportunities for vibration monitoring instruments. Looking to the future, the development of key performance indicators (noise, bandwidth and dynamic range), coupled with a high degree of functional integration, will surely drive this trend forward.
Kara offers a wide range of illuminated and non-illuminated Rocker Switches.In this series,Rated current 6A,10A,16A,Ranging from 1 to 6 poles,with many styles of colors and functions. Certifications include UL, CSA, TUV, CE, and more.
Why choose us?
1)As a manufacture, all of our switch parts are made by our own factory in Ningbo. So, price is competitive.
2)We have our own UL testing lab in Taiwan, so quality can be guaranteed.
3) We can provide you with different types of rotary switches for your selection.
4) Various operating force,height and colour for one switch for your choice.
5) Safety, on-time delivery, excellent quality with competitive price.
6) MOQ: 1000pcs,mixed order acceptable, welcome trial order.
7) OEM and ODM professional design.
8) We can provide free samples for your test.


Small-Sized Rocker Switches,Round Rocker Switch,Small Rocker Switch,Mini Rocker Switch
Ningbo Kara Electronic Co.,Ltd. , https://www.kara-switch.com