Fixed frequency boost converters are ideal for driving LED strings in constant current mode. Operating in discontinuous conduction mode (DCM), this converter can be effectively used for fast dimming operations, providing superior transient response over competing devices operating in continuous conduction mode (CCM). When the LED is turned on, DCM operation provides fast transient performance and recharges the output capacitor, thus minimizing the analog dimming of the LED. In order to properly stabilize the DCM boost converter, there is a small signal model. However, the AC analysis of the boost converter that drives the LEDs is different from the AC analysis of a boost converter using a standard resistive load. Since series diodes require DC and AC load conditions, care must be taken when deriving the final transfer function.
This article (ie, Part 1) does not use the traditional small-signal model of the discontinuous conduction mode (DCM) boost converter, but instead uses a simplified method based on the output current expression of the converter under study. In Part 2 (actual considerations), we will delve into the application, verify the measurement accuracy, and compare it with theoretical derivation.
Boost converter for powering LED strings
Figure 1 shows a simplified circuit diagram of a constant frequency peak current mode boost converter that drives a string of LEDs. The output current is continuously monitored by the sense resistor Rsense. A corresponding output voltage is applied to the control circuit to continuously adjust the on-time of the power switch to provide a constant LED current Iout. This is the controlled output variable.
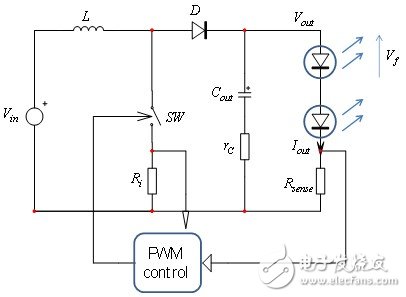
Figure 1 shows a boost converter that drives a string of LEDs to illuminate. The output current is regulated to the set point value.
When illuminated, the LED string produces a voltage across the LED connection. This voltage depends on the threshold voltage VT0 associated with each LED technology and its dynamic impedance rd. Therefore, the total voltage drop across the LED string is the sum of the threshold voltages of the LEDs, VZ, while the dynamic impedance rLEDs represents the sum of the series dynamic impedances of the LEDs. Figure 2 shows the equivalent circuit used. You can characterize the LED string voltage drop and its total dynamic impedance yourself. For measurement purposes, the LED string current is biased to its nominal current IF1. Once the LED is thermally stable, the total voltage drop Vf1 across the LED string is measured. Change the current to a slightly lower value IF2 and measure the new voltage drop VF2. Based on these values, you can calculate the total dynamic impedance, ie:
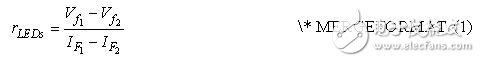
The "Zener" voltage is approximately equal to the LED string voltage VF1 minus the product of rLEDs and the measured point current:

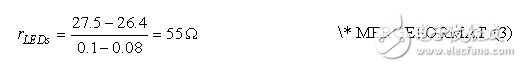
We assume that our LED string is biased with a current of 100 mA. The total pressure drop measured was 27.5 V. We reduce the current to 80 mA and the new voltage drop is 26.4 V. The calculation of total dynamic impedance is simple:
According to the equation, we can simply calculate the Zener voltage:
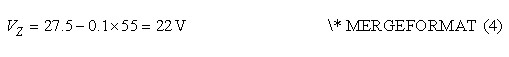
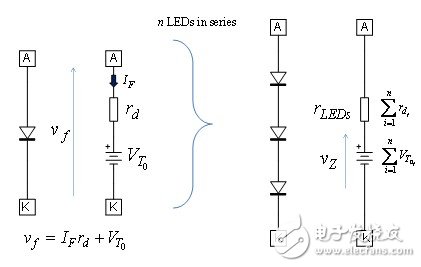
Figure 2: LEDs are connected in series, so their threshold voltages need to be accumulated; and the total dynamic impedance is the sum of the dynamic impedances of the individual LEDs connected in series.
Looking back at Figure 1. The LED string is connected in series with the sense resistor Rsense. The total alternating current (ac) impedance is therefore the sum of the two:

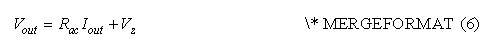
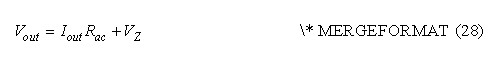
Figure 3 is a greatly simplified equivalent direct current (dc) circuit diagram. The DC output voltage Vout is equal to the product of the output current Iout and the resistor Rac plus the Zener voltage:
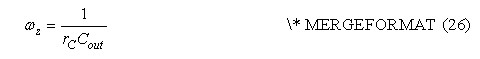
Under AC conditions, since the Zener voltage is constant, the above equation can be simplified to:
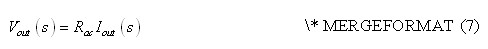
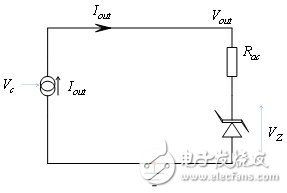
Figure 3: This DC simplified circuit diagram shows the equivalent Zener diode and its dynamic impedance.
Simplified model
The current source actually refers to the current that is transmitted from the input supply to the output without loss. The current source can be adjusted up or down by the control voltage Vc, and Vc sets the inductor peak current cycle by cycle. The controller uses the boost converter to switch the current sense resistor Ri to observe the inductor peak current and operate accordingly. When the voltage across the Ri matches the control voltage, the power switch is turned off.
If we are considering an AC circuit diagram now, we should consider the capacitor and its parasitic components, as shown in Figure 4. The Zener component itself has no effect because its voltage remains constant during AC modulation: only its dynamic impedance rLEDs need to be considered and integrated into the Rac. As described in equation (5).
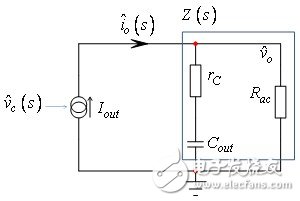
Figure 4: The AC model uses the total impedance Rac associated with the capacitance model.
According to this figure, it is possible to express the small signal output voltage level when the control voltage is modulated:
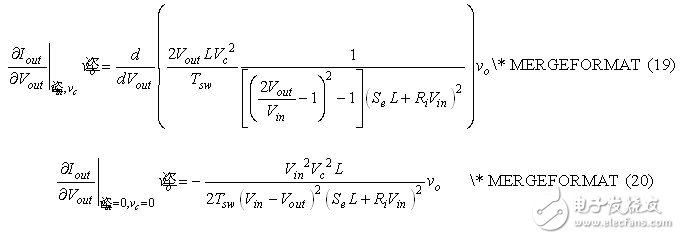
As mentioned earlier, the current source value depends on the control and output voltage. To derive the small-signal equivalent model, we analyze the Iout partial derivative associated with the control voltage Vc and the output voltage Vout:
Combined with the equation, the equation can be rewritten as follows:
The reference [1] (Equation 1-111, page 49) has derived the DC transfer function of the DCM boost converter, namely:
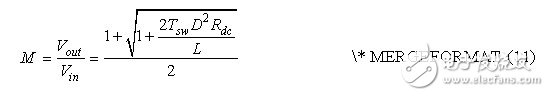
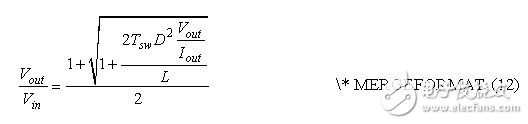
In this equation, the converter's DC resistance (Rdc) must be  Alternative. The new equation becomes:
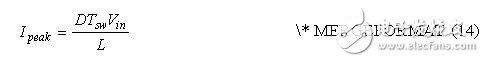
We need to derive the equation of the duty cycle (D) and the control voltage Vc according to this equation. In the presence of a compensation ramp, the control voltage is no longer a fixed DC voltage, but the slope affects the ramp voltage at the final peak current set point. Figure 5 shows the final waveform. The time to reach the peak current value is faster than in the absence of a slope, as if we would artificially increase the current control sense resistor Ri. It has the effect of reducing the current control loop gain and reducing the two poles in continuous conduction mode (CCM). When the converter transitions to DCM, there are still slopes that must be taken into account.
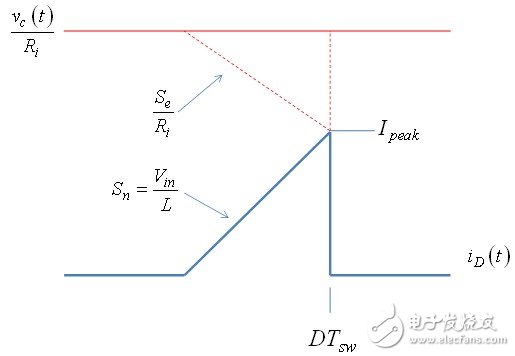
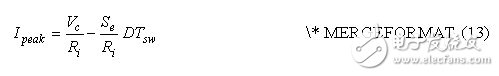
Figure 5: Due to the compensation ramp, the peak current is not equal to the control voltage divided by Rsense.
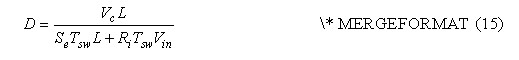
The relevant equation is as follows, taking into account the scaling factor Ri because the external ramp Se is a voltage ramp:
A similar equation involving the slope of the inductor current can be derived:
To resolve the duty cycle D, we get:
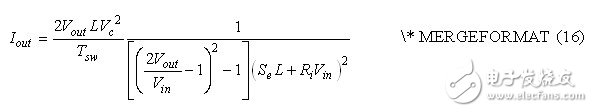
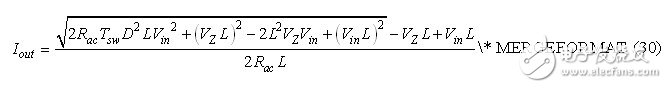
By substituting this equation into the equation, we solve the output current Iout:
In order to obtain a small signal value, we calculate the partial derivative of Iout related to the control voltage Vc and the output voltage Vout as in equation (10):
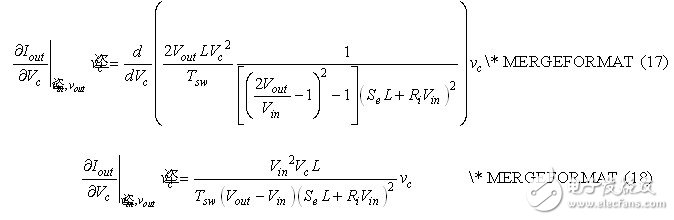
This equation describes the effect of the small signal model of vc on the output current.
Equation (20) expresses the correlation between the current and the voltage and the product of a coefficient of magnitude g. It is a voltage controlled current source, as shown in Figure 6.
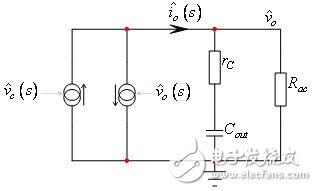
Figure 6: The coefficient in the equation is the voltage-controlled current source, which is the impedance.
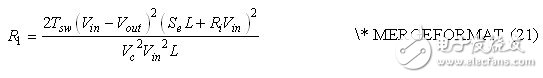
Due to the negative sign in equation (20), the current direction is reversed. Therefore, since we have a voltage-driven current source, it is equivalent to a resistor, which is defined as follows:
In this simplified equation, a current source refers to electrical energy that is absorbed from an input source and transmitted to an output. The current source equation does not cover information related to the mode of operation of the converter. For example, looking back at equation (16), we are not aware that the device is operating in a fixed frequency mode, transferring power to the output load during the on time or during the off time, and so on. In the absence of such information, it is obvious to avoid some second-order components, such as the right half-plane zero (RHPZ). However, from the previous analysis, we know that RHPZ still exists in DCM work, but since it is classified as high frequency, we can ignore its existence in this case. The advantage of this simplified approach is the ability to quickly derive the digging model, giving you the low-frequency characteristics of the architecture under consideration: DC gain and pole/zero combination. Another approach that can be taken is to use the small signal model of the DCM current mode boost converter for a complete analysis from the load consisting of the components in Figure 4. This method will provide exact results, but will require more iterations and complex equations.
Complete communication model
Now that we have derived all the coefficients, we can update the model shown in Figure 4 earlier. The updated circuit diagram is shown in Figure 7. R1 corresponds to the coefficients in the equation and can derive a current that is directly proportional to the output voltage modulation.
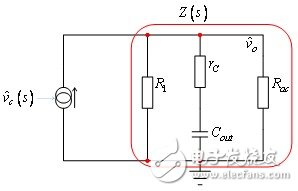
Figure 7: We will calculate the complete transfer function based on this updated AC model diagram.
In order to derive the transfer function of interest  We will simplify the circuit and look at the load impedance Z of the current source. Its definition is as follows:
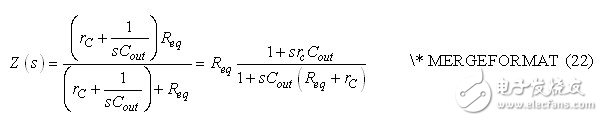
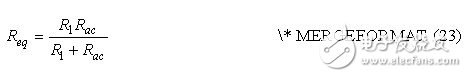
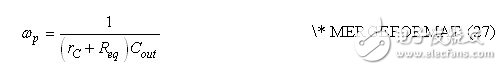
In the above equation, Req is a parallel combination of Rac and R1:
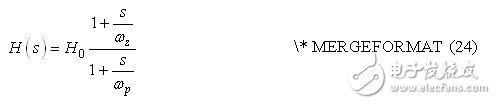
Therefore, the complete transfer function is the coefficient given in equation (18) multiplied by the impedance in equation (23), which is the pole/zero combination impedance Req given by equation (22):
among them,
Derivation work point
Before estimating the AC function, we need to express the correlation between the operating point and the output current and the control voltage Vc. We know that the output voltage is equal to:
We can substitute this definition into the equation:
According to this equation, we can parse out Iout:
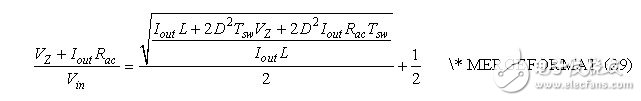
We can also replace the duty cycle D according to equation (15). In this case, the output current equation becomes very complicated, but it is also useful:
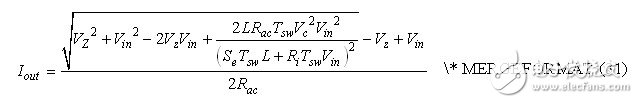
According to this equation, if we know the LED string voltage VZ and its dynamic impedance rLEDs, we can predict the current supplied by the boost converter. We next verify these equations with actual examples.
Practical application
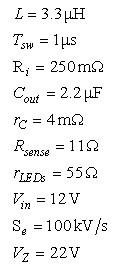
We will use the following values ​​to test our calculations. This is a DCM boost converter that provides constant power for a 22 V drop LED string.
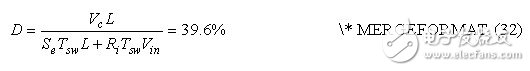
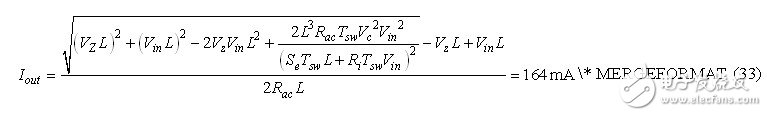
To calculate this current, we assume that the control voltage Vc is 400 mV. We can calculate the duty cycle by equation (15):
The output current can be obtained from equation (31):
Then you can quickly calculate the output voltage:

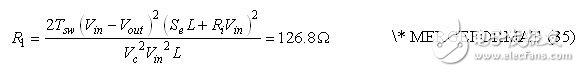
The value of the additional resistor R1 calculated in equation (21) is calculated as follows:
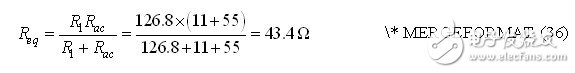
When R1 is connected in parallel with Rac, referring to equation (23), it becomes:
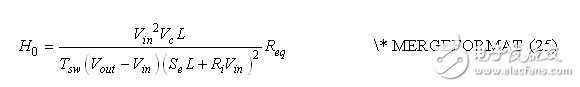
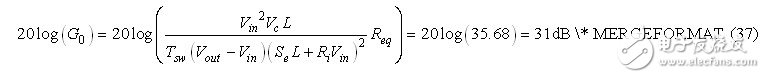
We can now calculate the static gain H0:
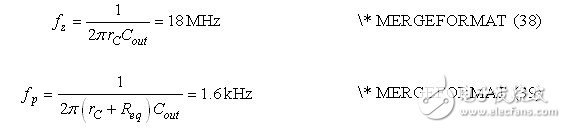
The derived poles and zeros are as follows:
The SPICE simulation can be run to verify the validity of this bias point. We used the large-signal auto-trigger current model derived from page 161 of Reference [1]. The bias points of the circuit diagram and reflection are shown in Figure 8. In this circuit diagram, in order to obtain the correct dynamic impedance operating voltage, we use a simple shunt regulator to mimic the operation of a perfect Zener diode. This perfect diode provides a breakdown voltage VZ of 22 V with a dynamic impedance of 55 Ω. It should be noted that a simple 22 V DC source can be used for AC analysis, but not for any transient simulation conditions such as startup. When running the AC scan time division, SPICE linearizes the circuit around the operating point and produces a small signal model. The results shown in the circuit diagram are not far from the results we obtained from the analytical analysis. The sense resistor current arrives at a control voltage of 0.4 V  , close to the value calculated in equation (33).
The Bode plot of the controlled system is shown in Figure 9. The direct gain is close to the result of equation (37), with the pole at the appropriate position (1.6 kHz). The phase continues to drop because the high frequency RHPZ is at a high frequency. Our simplified approach cannot predict the existence of this RHPZ. It exists or not with the topology of the topology: the boost converter stores the power energy in the inductor during the on-time and discharges it to the load during the shutdown period. Any load change, such as an increase in output current, must first be jumped through the inductor and then supplied to the output. The inherent delay of this mode of operation is modeled by RHPZ. This energy transfer delay does not appear significantly in equation (16) because the equation simply relates the current to the control voltage Vc. However, under DCM conditions, the left half-plane zero (LHPZ) defined in equation (38) occurs at frequencies significantly above the operating frequency Fsw.
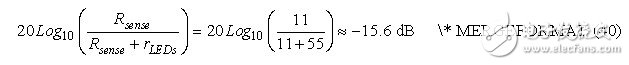
It should be noted that we analyzed the output voltage while actually stabilizing the LED current. When we observe the voltage across the sense resistor Rsense, the feedback signal is Vout adjusted downward according to the voltage division ratio consisting of rLEDs and Rsense. The proportional adjustment becomes:
This curve is also characterized in Figure 8.
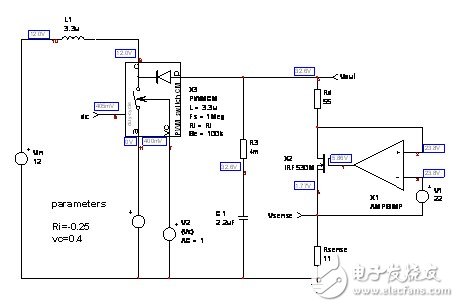
Figure 8: The average model helps verify the work bias point and AC response.
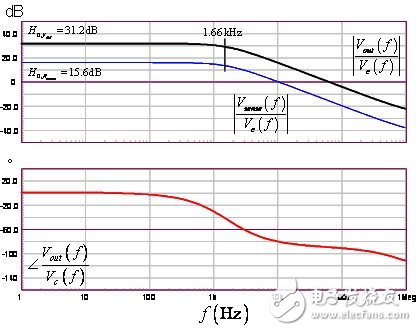
Figure 9: Bode plot confirms DC gain and pole position.
in conclusion
This first part of the article describes how to derive the small signal response of a boost converter that drives an LED string. This article does not apply the complete small-signal model of the DCM boost converter, but instead derives a simple equation describing the first-order response of an LED boost converter operating in discontinuous conduction mode. Despite the inherent limitations of the first order, the answer to the brief analysis is sufficient to stabilize the control loop. In the second part (actual considerations), we will delve into the implementation and verify the empirical results and compare them with theoretical derivations.
Electric dc motors were the first type widely used, since they could be powered from existing direct-current lighting power distribution systems. A electric Dc Motor's speed can be controlled over a wide range, using either a variable supply voltage or by changing the strength of current in its field windings. Small electric dc motor are used in tools, toys, and appliances. The universal motor can operate on direct current but is a lightweight motor used for portable power tools and appliances. Larger electric dc motor are used in propulsion of electric vehicles, elevator and hoists, or in drives for steel rolling mills.
Areas of application: the Electric Dc Motor rotor part of the armature iron core, armature, commutator, such as equipment, electric dc motor is suitable for most electronic products, such as electric screwdriver, laser, smart home, gas valve, etc
Applications:


Method of use: the best stable in horizontal plane, installed on theelectric dc motor output shaft parts, cannot use a hammer to knock, knock prone to press into the electric dc motor drive, may cause damage to internal components, and cannot be used in the case of blocked.

Operating temperature range:
Electric dc motor should be used at a temperature of -10~60℃.
The figures stated in the catalog specifications are based on use at ordinary room temperature catalog specifications re based on use at ordinary room temperature (approximately20~25℃.
If a electric dc motor is used outside the prescribed temperature range,the grease on the gearhead area will become unable to function normally and the motor will become unable to start.Depending on the temperature conditions ,it may be possible to deal with them by changing the grease of the motor's parts.Please feel free to consult with us about this.
Storage temperature range:
Electric dc motor should be stored ta a temperature of -15~65℃.
In case of storage outside this range,the grease on the gearhead area will become unable to function normally and the motor will become unable to start.


Service life:
The longevity of geared motors is greatly affected by the load conditions , the mode of operation,the environment of use ,etc.Therefore,it is necessary to check the conditions under which the product will actually be used .The following conditions will have a negative effect on longevity.Please consult with us should any of them apply.
â—Use with a load that exceeds the rated torque
â—Frequent starting
â—Momentary reversals of turning direction
â—Impact loads
â—Long-term continuous operation
â—Forced turning using the output shaft
â—Use in which the permitted overhang load or the permitted thrust load is exceeded
â—A pulse drive ,e.g.,a short break,counter electromotive force,PWM control
â—Use of a voltage that is nonstandard as regards the rated voltage
â—Use outside the prescribed temperature or relative-humidity range,or in a special environment.
â—Please consult with us about these or any other conditions of use that may apply,so that we can be sure that you select the most appropriate model.
when it come to volume production,we're a major player as well .each month,we rurn out 600000 units,all of which are compliant with the rohs directive.Have any questions or special needed, please contact us, we have the engineer group and best sales department to service to you Looking forward to your inquiry. Welcome to our factory.

Electric Dc Motor
Electric Dc Motor,Mini Electric Motor,12V Electric Motor,Electric Motor Gearbox
Shenzhen Shunchang Motor Co., LTD. , https://www.scgearmotor.com